My coworker David shared an article with me recently, Why Is Interracial Marriage On The Rise? via Priceonomics.com, and I thought it was extremely well-written and included a lot of great stats and analysis of those stats. The first thing I learned was the difference between the term Interracial Marriage and Intermarriage. This is an important distinction (at least in the world of Census data) because Hispanic is considered an ethnic group, not a race. So intermarriage data includes Hispanics, whereas prior to 1980 the data was only collected on Interracial Marriages. So all of the stats that will be discussed below are inclusive of the Hispanic population and therefore fall into the Intermarriage category.
One of the charts I found most interesting was this breakdown of each state and what percentage of couples under 35 years of age were in intermarriages. I was not at all surprised to see that Hawaii ranked number 1, both with the military presence on the islands and the super strong Hapa community that resides there. I was a little surprised by Oklahoma and Alaska at first until I did a little research which explained that these high percentages are due to the large populations of Native Americans in Oklahoma, and Alaska Natives in Alaska who are marrying individuals that do not identify as the same race.
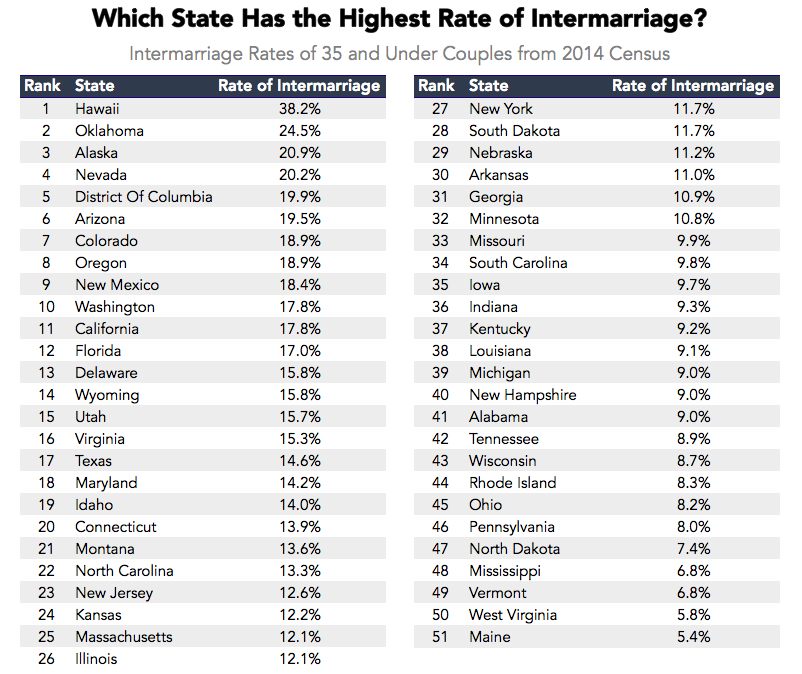
Overall the article stated that intermarriage rates in individual states are largely correlated to what percentage of its population is neither white or black. So, states with large populations of Hispanics or Asians lead to a higher rate of intermarriage. The article cites that Whites are particularly likely to intermarry with Asians and Hispanics which leads to the large numbers.

So in Maine, where 95% of the state is white, doesn’t have as much opportunity to “interdate” thus leading to a low percentage of intermarriages. West Virginia and Vermont are similar in that respect. Mississippi however is a little different, because their population is almost 38% black and 60% white. But that only leaves 2% for everyone else- so it makes sense why at 6.8% their number is so low. I have never personally been to Mississippi, but I would also be willing to throw out the notion that deep seeded segregation and racism also has a lot to do with it in many of the southern states- this list of Top 10 Most Racist States in America backs up my hunch.
Another interesting point the Priceonomics.com article is making is that the rise of Interracial Marriages can’t necessarily be attributed to changing beliefs or attitudes about race.
Our “no-demographic change” estimate suggests that intermarriage would have only risen to 6.7% if demographics had not changed – a 1.9% increase, dramatically smaller than the 8.6% increase actually observed.

So in other words, it is the demographic changes that have happened in our country since the 1980s that have largely increased the rate of interracial marriage or intermarriage, not because everyone is suddenly totally down with a Swirl Nation (shameless plug:).
Hispanics, Asians, and those who identify as Other are leading that demographic change. In 1980 that group accounted for 10% of the population, but today it is 29%. This also explains why there is more opportunity to intermarry today. As the article states:
Almost surely, some of the Whites who were not intermarried in 1980 would have been more likely to marry a person from different race or ethnicity had the population been more diverse. If you grow up in a town with only one non-White family, the intermarriage rate doesn’t really reflect your beliefs. That’s partially why White people were three times less likely to intermarry in 1980 than in 2014: there were half as many opportunities. Only about 17% of young married people were not White in 1980, compared to 35% today.
The percentage of intermarried Whites more than tripled from 2.7% in 1980 to 8.5% 2014. A big increase but no where near as dramatic as the numbers for the black population. In 1980, less than 4% of all married Black people under the age of 35 were not married to other black people, today the rate is 18.7%!

Interestingly enough the rate of Asians and Hispanics intermarrying has actually decreased since 1980, which you can see represented in the chart above. An article in the NY Times offered the following insight on the decline within the Asian-American community:
From 2008 to 2010, the percentage of Asian-American newlyweds who were born in the United States and who married someone of a different race dipped by nearly 10 percent, according to a recent analysis of census data conducted by the Pew Research Center. Meanwhile, Asians are increasingly marrying other Asians, a separate study shows, with matches between the American-born and foreign-born jumping to 21 percent in 2008, up from 7 percent in 1980.
Asian-Americans still have one of the highest interracial marriage rates in the country, with 28 percent of newlyweds choosing a non-Asian spouse in 2010 (About 36 percent of Asian-American women married someone of another race in 2010, compared with about 17 percent of Asian-American men), according to census data. But a surge in immigration from Asia over the last three decades has greatly increased the number of eligible bachelors and bachelorettes, giving young people many more options among Asian-Americans. It has also inspired a resurgence of interest in language and ancestral traditions among some newlyweds.
A similar story can be told for the Hispanic community, as studied by Zhenchao Qin, a professor at Ohio State University who found that education level also played a large role in intermarriage when it came to the Asian and Hispanic communities in particular.
Studies show the number of native-born Hispanic men in intermarriages with whites declined by nearly 4 percentage points between 1990 and 2000 – from 35.3 percent to 31.9 percent.
The study found that education played a key role in defining who participated in interracial marriages. For example, native-born Hispanic women with a college education were more than three times more likely to be in a marriage with whites compared to their counterparts with less than high school education. The differences in intermarriage as a function of education were even larger for foreign-born minorities.
Qian said,
“The melting pot is clearly bubbling, but mostly along class lines, with the highly educated most likely to cross racial and ethnic lines to marry.”
It will be interesting to see how these numbers continue to evolve over time with the continued influx of immigrants from Asia and Latin America, as well as the growing multiracial population. Qian did note that a change U.S. Census forms in 2000 plays a key role. This was the first time respondents were able to choose more than 1 race on their form. This change has made it more difficult to “understand marital assimilation” according to Qian. But his study did reveal that bi-racial American Indian-white or Asian American-white individuals were more likely to be married to whites rather than American Indians or Asian Americans. It was also mentioned that historically individuals who are mixed African-American and white have traditionally identified as black for the purpose of these studies. If our blog is any indication, then I think this will be changing as more and more individuals identify as multiracial.
Does this data surprise you? I know for me it was surprising to see that if demographics had not shifted at all, then the percentage of intermarriages would still be VERY low (about 7%). I had really never put that much thought to the impact of the demographics, I guess because I have lived in fairly diverse urban areas my entire adult life (except for college- Boulder, CO is not exactly the poster child for diversity), and have always been around a lot of "intercouples". But now that I think about it, it makes sense. As much as I would like to think America has had this huge shift when it comes to race, we all clearly know that is not the case. Never has that been more clear than in recent months.
All of us who are passionate about the multiracial community will play a large role in shaping the future state of this data. While it might mean less clear-cut data for the analysts to interpret, with the wide variations of multiracial people, it should also mean a fresh perspective on demographics. As Pew Social Trends reports:
Multiracial Americans are at the cutting edge of social and demographic change in the U.S.—young, proud, tolerant and growing at a rate three times as fast as the population as a whole.
As America becomes more racially diverse and social taboos against interracial marriage fade, a new Pew Research Center survey finds that majorities of multiracial adults are proud of their mixed-race background (60%) and feel their racial heritage has made them more open to other cultures (59%).
That point of "being open to other cultures" being key I think as we look at the future of race and marriage. Today, nearly half (46%) of all multiracial Americans are younger than 18 and as the data suggests, it is quite likely that they may grow up to marry other multiracial individuals.
As a group, mixed-race adults are much more likely than all married adults to have a spouse or partner who is also multiracial,the survey finds. Among all mixed-race adults who are married or living with a partner, about one-in-eight (12%) say their spouse or partner is two or more races. By comparison, only 2% of adults among the general public who are married or living with a partner say the same.
So the story continues to unfold! Let us know your thoughts on these stats and studies!